Sparklines
A sparkline is a small chart which can be applied to quickly visualize data and transform it in a compact form in a cell. It uses data from a range of cells to help you easily analyze data at the cell level.
You can set the sparkline type to column, line, or winloss by using the AddSparkline method or use type-specific formulas to create different sparklines available.
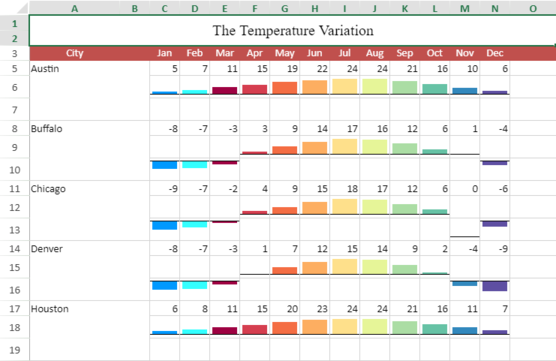
The image below shows the Vbar sparkline in action. It shows the trends in the temperature levels across a year in different cities and helps to quickly understand the high and low data points.

Refer to the following list of topics while working with sparkline.
| Topic | Content |
|---|---|
| Add Sparklines Using Methods |
Add column, line, and winloss sparklines using methods and perform following operations: |
| Add Sparklines using Formulas | Add different types of sparklines such as pie, histogram, stacked, etc. using formulas. |