Histograms are used to represent the frequency distribution of a data set. Spread for Winforms allows you to create histogram sparklines by using the histogram sparkline function.
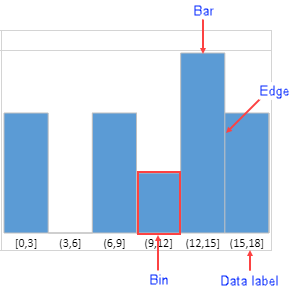
The above image shows a histogram sparkline and its elements:
- Bin: The data container which contains data of the specified range of values.
-
Bar: The paint block responsible for UI. The bar height is determined by the following expression if the paintLabel option is true:
(cellRowHeight - labelFontSize - 6px)
Otherwise it is determined by:(cellRowHeight - 6px)
- Edge: The border of bar.
-
Data Label: The data range displayed in the sparkline. The data label font size is determined by the expression:
Math.floor(cellRowHeight/3)
- If the font size is more than the expression, then the largest integer less than or equal to the expression is taken as the font size.
- If the height of the cell is less than cell row height, the font size is 12px.
Types of Histogram Sparklines
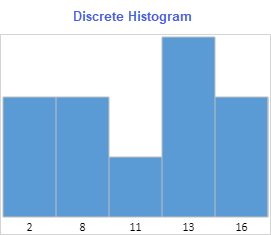
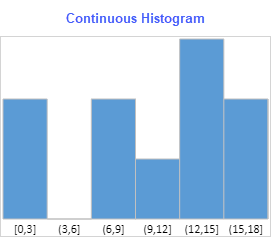
The Histogram sparklines can be displayed in a discrete or continuous manner as shown below:
 |
 |
Discrete Histogram represents the data in a discrete manner (without continuous intervals) by taking existing values. For example: 20, 34, 38. The values are painted in ascending order.
Continuous Histogram represents the data by taking a range of continuous values. The intervals for the first bin are left-closed and right-closed, whereas intervals for rest of the bins are left-open and right-closed.
- The lower bound is calculated using:
Math.floor(minValue/scale)*scale
Whereas the upper bound is calculated using:Math.ceil(maxValue/scale)*scale
- The width of bin is 1, by default
- If the scale is lower than 0, the sparkline is set to 1
The type of histogram can be specified by using the continuous option in the HistogramSparkline formula.
The histogram sparkline formula has the following syntax:
=HISTOGRAMSPARKLINE(dataRange, [continuous, paintLabel, scale, barWidth, barColor, labelFontStyle, labelColor, edgeColor])
The formula options are described below:
| Option | Description |
|---|---|
|
dataRange |
Specifies the range of data sources. It supports a range.
It supports calc array and calc reference. |
|
continuous Optional |
If set to true, the sparkline is a continuous histogram.
If set to false, the sparkline is a discrete histogram. The default value is true. |
|
paintLabel Optional |
If set to true, the sparkline paints the data label. The default value is false. |
|
scale Optional |
Specifies the bin width. This value is useful when histogram type is continuous. The default value is false. |
|
barWidth Optional |
Specifies the bar width. Default value is 1. Bar width = auto calc width * barWidth Value range is 0 < value ≤ 1. |
|
barColor Optional |
Specifies the color of the bar. Default value is '5B9BD5'. Supports CSS color property. |
|
labelFontStyle Optional |
Specifies the font style of the data label font. The default value is 9pt Calibri. Supports CSS font property. It supports font-style, font-weight, font-size, font-family. |
|
labelColor Optional |
Specifies the font color of data label font.
Default is black (#00000). Supports CSS color string. |
|
edgeColor Optional |
Specifies the color of the edge.
Default value is silver (#C0C0C0). Supports CSS color property. |
Notes
- The default padding of sparkline is 3px.
- The paintLabel option does not paint the data label when the custom font size is more than one-third of cell row height.
- The data label does not paint when any of the data label's width is bigger than the bar's average width. The average width is determined by the expression (cell width/bar count).
For example, for 100px cell width, there are 5 bars in the sparkline. The bar average width is 20px. In this sparkline, if any data label is wider than 20px, the data label does not paint. - In the data range, any non-number type value is ignored.
Usage Scenario
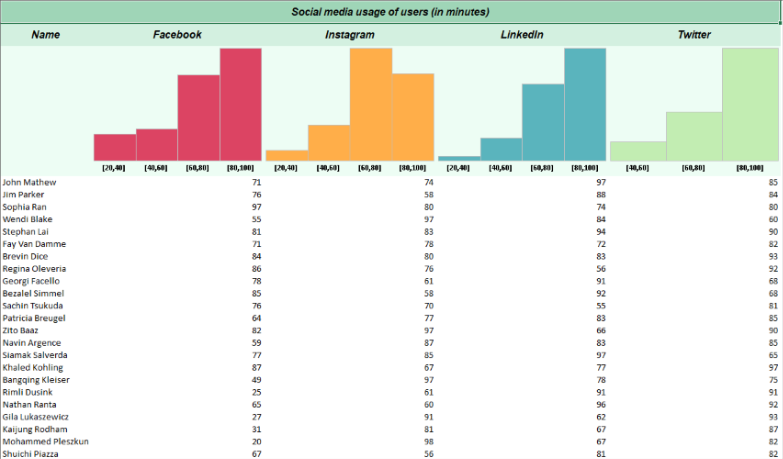
Consider a scenario where an organization has conducted a survey of social media consumption by users on a weekly basis. The histogram sparkline can depict these statistics and analyze the trends about how much time users spent on different social media platforms.
| C# |
Copy Code
|
|---|---|
// Set data for histogram sparkline worksheet.SetValue(1, 0, new object[,] { { "Name", "Facebook", "Instagram", "LinkedIn", "Twitter" } }); worksheet.SetValue(3, 0, new object[,] { {"John Mathew", 71, 74, 97, 85}, {"Jim Parker", 76, 58, 88, 84}, {"Sophia Ran", 97, 80, 74, 80}, {"Wendi Blake", 55, 97, 84, 60}, {"Stephan Lai", 81, 83, 94, 90}, {"Fay Van Damme", 71, 78, 72, 82}, {"Brevin Dice", 84, 80, 83, 93}, {"Regina Oleveria", 86, 76, 56, 92}, {"Georgi Facello", 78, 61, 91, 68}, {"Bezalel Simmel", 85, 58, 92, 68}, {"Sachin Tsukuda", 76, 70, 55, 81}, {"Patricia Breugel", 64, 77, 83, 85}, {"Zito Baaz", 82, 97, 66, 90}, {"Navin Argence", 59, 87, 83, 85}, {"Siamak Salverda", 77, 85, 97, 65}, {"Khaled Kohling", 87, 67, 77, 97}, {"Bangqing Kleiser", 49, 97, 78, 75}, {"Rimli Dusink", 25, 61, 91, 91}, {"Nathan Ranta", 65, 60, 96, 92}, {"Gila Lukaszewicz", 27, 91, 62, 93}, {"Kaijung Rodham", 31, 81, 67, 87}, {"Mohammed Pleszkun", 20, 98, 67, 82}, {"Shuichi Piazza", 67, 56, 81, 82}, {"Katsuo Leuchs", 83, 74, 51, 42}, {"Masanao Ducloy", 67, 64, 58, 73}, {"Mihalis Crabtree", 80, 91, 57, 84}, {"Danny Lenart", 92, 38, 99, 86}, {"Yongqiao Dalton", 85, 61, 73, 81}, {"Gaetan Veldwijk", 64, 52, 76, 72}, {"Leszek Pulkowski", 95, 75, 64, 99}, {"Weidon Gente", 77, 88, 77, 96}, {"Krister Stranks", 72, 38, 89, 55}, {"Ziyad Baaz", 89, 81, 83, 48}, {"Ymte Perelgut", 67, 70, 97, 94}, {"Tonia Butner", 99, 71, 87, 76}, {"Shigeaki Narlikar", 78, 80, 80, 97}, {"Ayakannu Beerel", 86, 61, 85, 81}, {"Moni Bale", 60, 72, 71, 86}, {"Manohar Heemskerk", 97, 60, 75, 78}, {"Angus Swan", 33, 97, 99, 99}, {"Christ Murtagh", 91, 76, 73, 80}, {"Maren Baez", 45, 77, 86, 88}, {"Greger Jahnichen", 98, 89, 81, 63}, {"Ymte Duclos", 95, 83, 72, 72}, {"Chenyi Hainaut", 81, 97, 99, 87}, {"Kasidit Picel", 87, 80, 88, 80}, {"Elrique Walstra", 96, 54, 38, 54}, {"Adel Reghbati", 56, 88, 81, 88} }); // Set HistogramSparkline formulas worksheet.Cells[2, 1].Formula = "HISTOGRAMSPARKLINE(Sheet1!B4: B51, true, true, 20, 1,\"#DC4463\", \"bold normal 10pt Calibri\", \"black\")"; worksheet.Cells[2, 2].Formula = "HISTOGRAMSPARKLINE(Sheet1!C4: C51, true, true, 20, 1, \"#FFAE49\", \"bold normal 10pt Calibri\", \"black\")"; worksheet.Cells[2, 3].Formula = "HISTOGRAMSPARKLINE(Sheet1!D4: D51, true, true, 20, 1, \"#5AB4BD\", \"bold normal 10pt Calibri\", \"black\")"; worksheet.Cells[2, 4].Formula = "HISTOGRAMSPARKLINE(Sheet1!E4: E51, true, true, 20, 1, \"#C2EDB2\", \"bold normal 10pt Calibri\", \"black\")"; |
|
| Visual Basic |
Copy Code
|
|---|---|
'Set data for histogram sparkline worksheet.SetValue(1, 0, New Object(,) { {"Name", "Facebook", "Instagram", "LinkedIn", "Twitter"} }) worksheet.SetValue(3, 0, New Object(,) { {"John Mathew", 71, 74, 97, 85}, {"Jim Parker", 76, 58, 88, 84}, {"Sophia Ran", 97, 80, 74, 80}, {"Wendi Blake", 55, 97, 84, 60}, {"Stephan Lai", 81, 83, 94, 90}, {"Fay Van Damme", 71, 78, 72, 82}, {"Brevin Dice", 84, 80, 83, 93}, {"Regina Oleveria", 86, 76, 56, 92}, {"Georgi Facello", 78, 61, 91, 68}, {"Bezalel Simmel", 85, 58, 92, 68}, {"Sachin Tsukuda", 76, 70, 55, 81}, {"Patricia Breugel", 64, 77, 83, 85}, {"Zito Baaz", 82, 97, 66, 90}, {"Navin Argence", 59, 87, 83, 85}, {"Siamak Salverda", 77, 85, 97, 65}, {"Khaled Kohling", 87, 67, 77, 97}, {"Bangqing Kleiser", 49, 97, 78, 75}, {"Rimli Dusink", 25, 61, 91, 91}, {"Nathan Ranta", 65, 60, 96, 92}, {"Gila Lukaszewicz", 27, 91, 62, 93}, {"Kaijung Rodham", 31, 81, 67, 87}, {"Mohammed Pleszkun", 20, 98, 67, 82}, {"Shuichi Piazza", 67, 56, 81, 82}, {"Katsuo Leuchs", 83, 74, 51, 42}, {"Masanao Ducloy", 67, 64, 58, 73}, {"Mihalis Crabtree", 80, 91, 57, 84}, {"Danny Lenart", 92, 38, 99, 86}, {"Yongqiao Dalton", 85, 61, 73, 81}, {"Gaetan Veldwijk", 64, 52, 76, 72}, {"Leszek Pulkowski", 95, 75, 64, 99}, {"Weidon Gente", 77, 88, 77, 96}, {"Krister Stranks", 72, 38, 89, 55}, {"Ziyad Baaz", 89, 81, 83, 48}, {"Ymte Perelgut", 67, 70, 97, 94}, {"Tonia Butner", 99, 71, 87, 76}, {"Shigeaki Narlikar", 78, 80, 80, 97}, {"Ayakannu Beerel", 86, 61, 85, 81}, {"Moni Bale", 60, 72, 71, 86}, {"Manohar Heemskerk", 97, 60, 75, 78}, {"Angus Swan", 33, 97, 99, 99}, {"Christ Murtagh", 91, 76, 73, 80}, {"Maren Baez", 45, 77, 86, 88}, {"Greger Jahnichen", 98, 89, 81, 63}, {"Ymte Duclos", 95, 83, 72, 72}, {"Chenyi Hainaut", 81, 97, 99, 87}, {"Kasidit Picel", 87, 80, 88, 80}, {"Elrique Walstra", 96, 54, 38, 54}, {"Adel Reghbati", 56, 88, 81, 88} }) 'Set HistogramSparkline formulas worksheet.Cells(2, 1).Formula = "HISTOGRAMSPARKLINE(Sheet1!B4: B51, true, true, 20, 1,""#DC4463"", ""bold normal 10pt Calibri"", ""black"")" worksheet.Cells(2, 2).Formula = "HISTOGRAMSPARKLINE(Sheet1!C4: C51, true, true, 20, 1, ""#FFAE49"", ""bold normal 10pt Calibri"", ""black"")" worksheet.Cells(2, 3).Formula = "HISTOGRAMSPARKLINE(Sheet1!D4: D51, true, true, 20, 1, ""#5AB4BD"", ""bold normal 10pt Calibri"", ""black"")" worksheet.Cells(2, 4).Formula = "HISTOGRAMSPARKLINE(Sheet1!E4: E51, true, true, 20, 1, ""#C2EDB2"", ""bold normal 10pt Calibri"", ""black"")" |
|
Using the Spread Designer
- Type data in a cell or a column or row of cells in the designer.
- Select a cell for the sparkline.
- Select the Insert menu.
- Select a sparkline type.
- Set the Data Range in the Create Sparklines dialog (such as =Sheet1!$E$1:$E$3).
Alternatively, set the range by selecting the cells in the range using the pointer.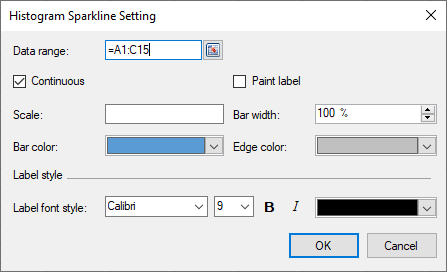
You can also set additional sparkline settings in the dialog if available.
- Select OK.
- Select Apply and Exit from the File menu to save your changes and close the designer.
