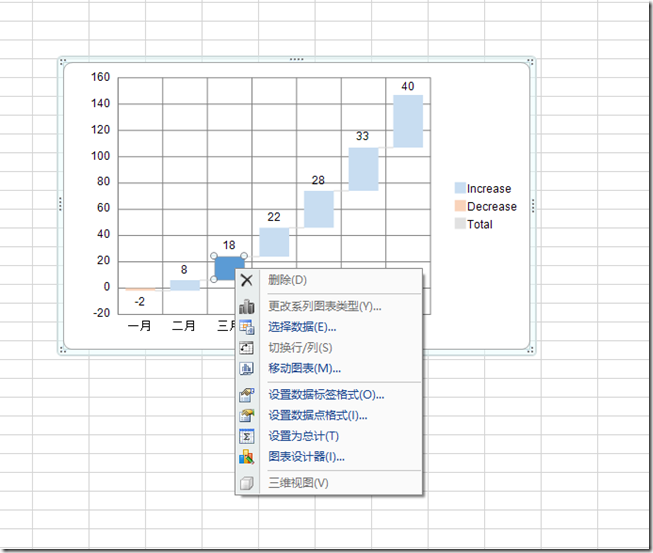
瀑布图作为时下非常流行的图表呈现方式,能够非常直接的表现出数值的变化关系。Spread for Windows Forms 也支持使用这种方式去绘制图表,下面就让我们来看看Spread for Windows Forms 如何进行瀑布图的绘制。
通过Spread Designer 或者 代码,我们可以非常轻松的将数据源绘制成一张瀑布图,以下就是两种方法的详细介绍:
一,使用Spread Designer
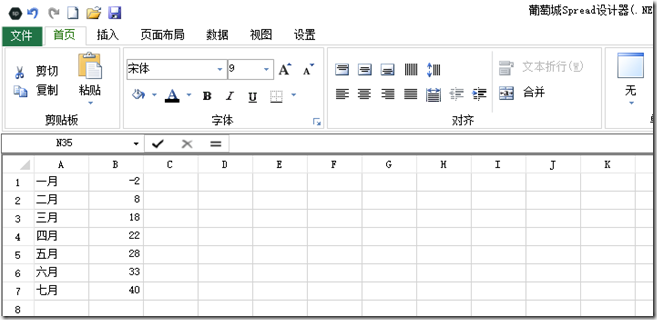
1.首先在设计器中加入数据源:
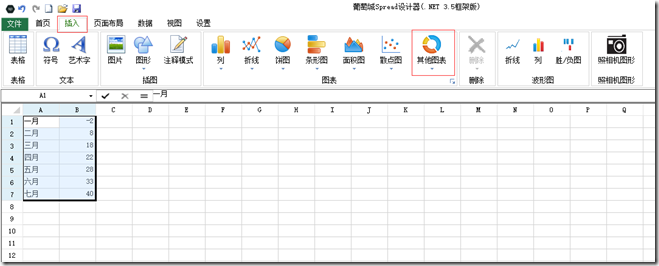
2.选中数据源,点击菜单栏的插入按钮打开插入tab,然后点击其他图表的按钮打开图表选单:
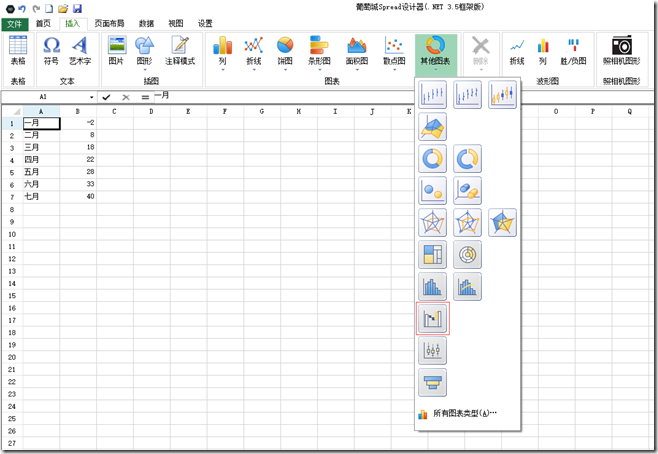
3.图表选单中选择瀑布图创建一个瀑布图:
4.图表选单中选择瀑布图创建一个瀑布图:
以上就生成了基本的瀑布图,Spread还支持对瀑布图的属性做一些修改,比如:
二,使用代码创建瀑布图
1.初始化series:
FarPoint.Win.Chart.WaterfallSeries wseries = new FarPoint.Win.Chart.WaterfallSeries();
2.设置series的名称:
wseries.SeriesName = "Series0";
3.设置x轴数据名称:
wseries.CategoryNames.Add("一月");
wseries.CategoryNames.Add("二月"); wseries.CategoryNames.Add("三月"); wseries.CategoryNames.Add("四月"); wseries.CategoryNames.Add("五月"); wseries.CategoryNames.Add("六月"); wseries.CategoryNames.Add("七月");
4.设置y轴数值:
wseries.Values.Add(-2);
wseries.Values.Add(8);
wseries.Values.Add(18);
wseries.Values.Add(22);
wseries.Values.Add(28);
wseries.Values.Add(33);
wseries.Values.Add(40);
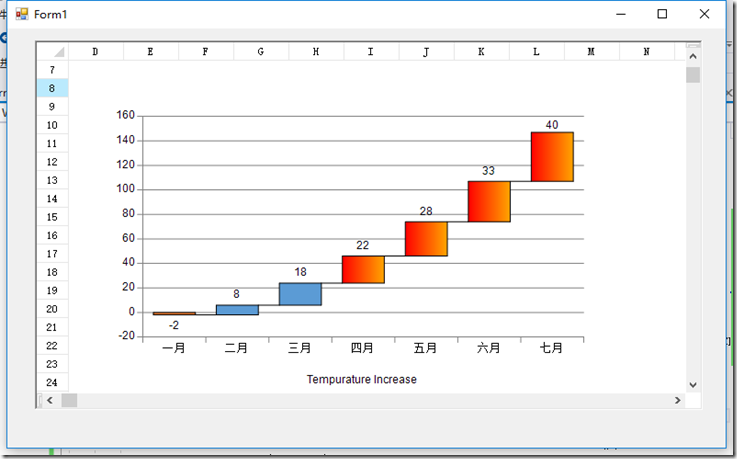
5.您可以通过代码修改边框和填充(支持渐变):
wseries.Border = new FarPoint.Win.Chart.SolidLine(Color.Black);
wseries.Fills.AddRange(new FarPoint.Win.Chart.Fill[] { null,null,null, new FarPoint.Win.Chart.GradientFill(Color.Red, Color.Orange), new FarPoint.Win.Chart.GradientFill(Color.Red, Color.Orange), new FarPoint.Win.Chart.GradientFill(Color.Red, Color.Orange) , new FarPoint.Win.Chart.GradientFill(Color.Red, Color.Orange)});
6.创建绘图区域,设置区域属性,并添加series:
FarPoint.Win.Chart.YPlotArea plotArea = new FarPoint.Win.Chart.YPlotArea();
plotArea.Location = new System.Drawing.PointF(0.2f, 0.2f);
plotArea.Size = new System.Drawing.SizeF(0.6f, 0.6f);
plotArea.Series.Add(wseries);
plotArea.XAxis.Title = "Tempurature Increase";
plotArea.XAxis.TitleOffset = 30;
7.创建一个chartmodel对象然后将绘图区域传入对象中:
FarPoint.Win.Chart.ChartModel model = new FarPoint.Win.Chart.ChartModel();
model.PlotAreas.Add(plotArea);
8.创建一个SpreadChart对象并且将该chartmodel对象添加进去并将chart添加到:
FarPoint.Win.Spread.Chart.SpreadChart chart = new FarPoint.Win.Spread.Chart.SpreadChart(); chart.Model = model; chart.Size = new Size(800, 400); chart.Location = new Point(100, 100); fpSpread1.Sheets[0].Charts.Add(chart);
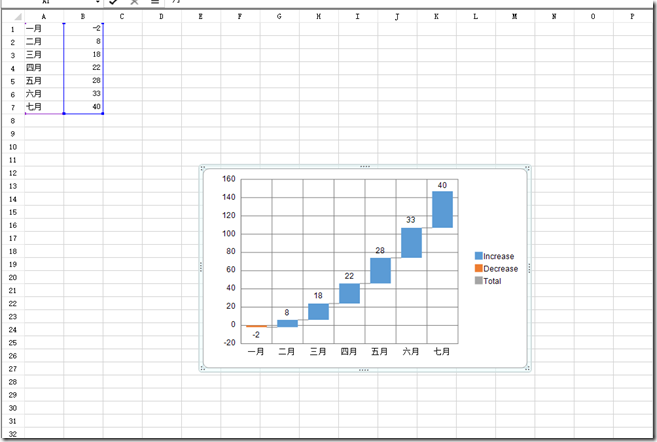
大功告成,效果如下图所示:
另外,以下是VB版本的代码,VB用户也可以使用Spread Windows Forms来绘制瀑布图:
Dim wseries As New FarPoint.Win.Chart.WaterfallSeries()
wseries.SeriesName = "Series0"
wseries.CategoryNames.Add("一月")
wseries.CategoryNames.Add("二月")
wseries.CategoryNames.Add("三月")
wseries.CategoryNames.Add("四月")
wseries.CategoryNames.Add("五月")
wseries.CategoryNames.Add("六月")
wseries.CategoryNames.Add("七月")
wseries.Values.Add(-2)
wseries.Values.Add(8)
wseries.Values.Add(18)
wseries.Values.Add(22)
wseries.Values.Add(28)
wseries.Values.Add(33)
wseries.Values.Add(40)
wseries.Border = New FarPoint.Win.Chart.SolidLine(Color.Black)
wseries.Fills.AddRange(New FarPoint.Win.Chart.Fill() {Nothing, Nothing,Nothing,New FarPoint.Win.Chart.GradientFill(Color.Red, Color.Orange), New FarPoint.Win.Chart.GradientFill(Color.Red, Color.Orange),New FarPoint.Win.Chart.GradientFill(Color.Red, Color.Orange),New FarPoint.Win.Chart.GradientFill(Color.Red, Color.Orange)})
Dim plotArea As New FarPoint.Win.Chart.YPlotArea()
plotArea.Location = New System.Drawing.PointF(0.2F, 0.2F)
plotArea.Size = New System.Drawing.SizeF(0.6F, 0.6F)
plotArea.Series.Add(wseries)
以上就是Spread Windows Forms实现瀑布图的主要内容。
相关源码下载请点击以下地址:
http://gcdn.grapecity.com.cn/forum.php?mod=viewthread&tid=38564&extra=page%3D1
有兴趣想要下载本产品的可以在以下网址进行下载试用:
Spread Windows Forms还可以实现很多精彩的功能,您可以访问以下站点进行详细了解:
