C1Chart用PlotElementLoaded事件实现柱子宽度自定义

《<a href="http://blog.gcpowertools.com.cn/post/2013/10/13/StudioforWPF_C1WPFChart_SymbolStyle.aspx">Studio for WPF:定制 C1WPFChart 标记</a>》详细说明了用<a href="http://helpcentral.componentone.com/nethelp/c1wpfchart/#!XMLDocuments/WPFChartRef/html/E_C1_WPF_C1Chart_DataSeries_PlotElementLoaded.htm">PlotElementLoaded</a>事件进行label设置,借用其思想,本文<a href="http://helpcentral.componentone.com/nethelp/c1wpfchart/#!XMLDocuments/WPFChartRef/html/E_C1_WPF_C1Chart_DataSeries_PlotElementLoaded.htm">PlotElementLoaded</a>进行C1Chart柱子宽度设置。<a href="http://www.grapecity.com.cn/image.ashx?picture=C1Chart_plot.gif"><img title="C1Chart_plot" style="border-top: 0px; border-right: 0px; border-bottom: 0px; border-left: 0px; display: inline" border="0" alt="C1Chart_plot" src="http://www.grapecity.com.cn/image.ashx?picture=C1Chart_plot.gif" width="447" height="273" /></a>

发布于 2014/05/19 00:00

ComponentOne Enterprise


Studio for WPF:定制 C1WPFChart 标记》详细说明了用PlotElementLoaded事件进行label设置,借用其思想,本文http://helpcentral.componentone.com/nethelp/c1wpfchart/#!XMLDocuments/WPFChartRef/html/E_C1_WPF_C1Chart_DataSeries_PlotElementLoaded.htm

22

故存在这样的需求:”还是没有办法让柱子保持一定的宽度。例如,我想让每个柱子的宽度保持在40个像素,不管数据量的多少“。

首先,采用设置X轴柱子整体边距的办法:

  1: BarColumnOptions.SetSize(c1Chart1, 2.0);

Chart默认的1.0属性,尝试修改为0.5、1.5、2.0后,依然无法达到要的效果。

其次,想到了以前用过的http://helpcentral.componentone.com/nethelp/c1wpfchart/#!XMLDocuments/WPFChartRef/html/E_C1_WPF_C1Chart_DataSeries_PlotElementLoaded.htm事件,在WPF UI发生变化后, Chart的序列、标签等会自动触发这个事件,我们可以在这个事件里面进行宽度等的修改。

关键代码如下:

  1:         void ds_PlotElementLoaded(object sender, EventArgs e)
  2:         {
  3:             var bar = (Bar)sender;
  4: 
  5:             var series = bar.DataPoint.Series;
  6:             int i = BarColumnOptions.GetStackGroup(series);
  7: 
  8:             // To avoid that the bar closes to the y axis is attached to the axis.
  9:             bar.Margin = new System.Windows.Thickness(10, 0, 0, 0);
 10: 
 11:              bar.RenderTransform = new TranslateTransform() { X = bar.ActualWidth / 4 };
 12:              bar.Width = 3;   //每个柱子的宽度
 13:         }

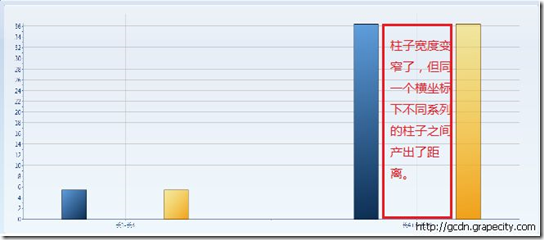
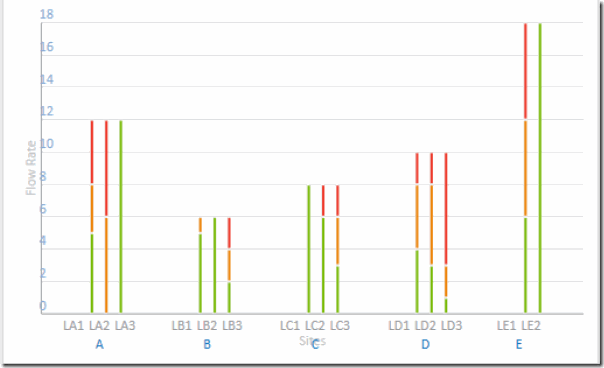
设置后,执行的效果如下,柱子变细了。


C1Chart_plot


源码下载:

关于葡萄城

葡萄城是专业的软件开发技术和低代码平台提供商,以“赋能开发者”为使命,致力于通过表格控件、低代码和BI等各类软件开发工具和服务,一站式满足开发者需求,帮助企业提升开发效率并创新开发模式。葡萄城开发技术始于1980年,40余年来始终聚焦软件开发技术,有深厚的技术积累和丰富的产品线。是业界能够同时赋能软件开发和低代码开发的企业。凭借过硬的产品能力、活跃的用户社区和丰富的伙伴生态,与超过3000家合作伙伴紧密合作,产品广泛应用于信息和软件服务、制造、交通运输、建筑、金融、能源、教育、公共管理等支柱产业。

相关产品
推荐相关案例
关注微信
葡萄城社区二维码

关注“葡萄城社区”

活字格低代码二维码

关注“活字格低代码”

想了解更多信息,请联系我们, 随时掌握技术资源和产品动态