使用Component One的C1Candlestickchart控件,我们可以轻松绘制一个股价图!下面为绘制股价图的具体步骤:
Step1:
首先我们创建一个ASP.Net Web应用程序,之后添加一个Web窗体。然后,在工具栏找到C1CandlestickChart 控件,如果工具栏没有C1CandlestickChart,我们可以点击右键选择“选择项”将C1CandlestickChart添加进来。
Step2:
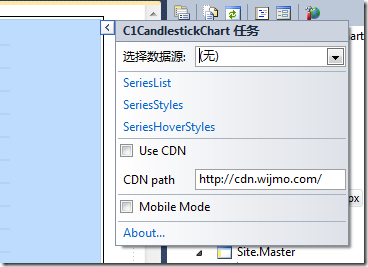
在设计视图下,将C1CandlestickChart控件拖到Web 窗体。点击控件打开C1CandlestickChart任务菜单,选择SreiesList。
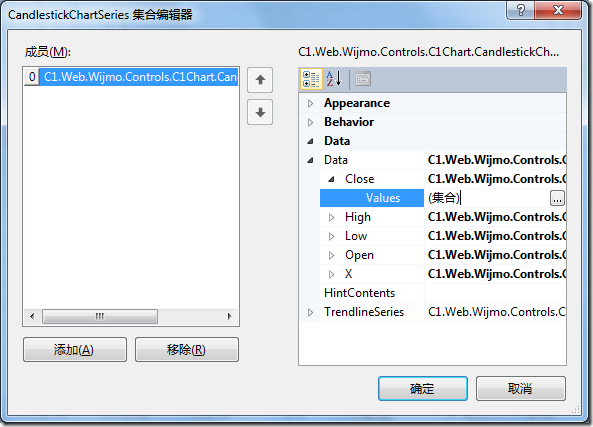
点击添加,修改右侧栏的Date的Close、High、Low、Open、X的值。
此示例将Low的值分别设置为7.5,8.6,4.4,4.2,8,9,11,10,12.2,12,16,15.5,16,15,16,16.5,16,16,15,14.5,
14,13.5,13,12,11,11,10,9,8,7.5,7.9,7.5,8.6,4.4,4.2,8,9,11,10,12.2,12,16,15.5,16
High的值分别设置为10,12,11,14,16,20,18,17,17.5,20,22,21,22.5,20,21,20.8,20,19,18,
17,16,15,15,14,13,12, 11.5,10.9,10,9,9.5,10,12,11,14,16,20,18,17,17.5,20,22,21,22.5
Open的值分别设置为8,8.6,11,6.2,13.8,15,14,12,16,15,17,18,17.2,18.5,17.8,18.6,19.8,18,16.9,15.6,14.7,
14.2, 13.9,13.2, 12.8,11.7,11.2,10.5,9.4,8.9,8.4,8,8.6,11,6.2,13.8,15,14,12,16,15,17,18,17.2
Close 的值分别设置为8.6,11,6.2,13.8,15,14,12,16,15,17,18,17.2,18.5,17.8,18.6,19.8,18,16.9,15.6,14.7,
14.2,13.9,13.2, 12.8,11.7,11.2,10.5,9.4,8.9,8.4,8,8.6,11,6.2,13.8,15,14,12,16,15,17,18,17.2,18.5
X的值从2011-12-01到2012-01-31 。
源视图下的代码如下:
1: <Data>2: <Low DoubleValues="7.5,8.6,4.4,4.2,8,9,11,10,12.2,12,16,15.5,16,15,16,16.5,16,16,15,14.5,14,13.5,13,12,11,3: 11,10,9,8,7.5,7.9,7.5,8.6,4.4,4.2,8,9,11,10,12.2,12,16,15.5,16" />4: <High DoubleValues="10,12,11,14,16,20,18,17,17.5,20,22,21,22.5,20,21,20.8,20,19,18,17,16,1515,14,13,12,5: 11.5,10.9,10,9,9.5,10,12,11,14,16,20,18,17,17.5,20,22,21,22.5" />6: <Open DoubleValues="8,8.6,11,6.2,13.8,15,14,12,16,15,17,18,17.2,18.5,17.8,18.6,19.8,18,16.9,15.6,14.7,14.2,7: 13.9,13.2, 2.8,11.7,11.2,10.5,9.4,8.9,8.4,8,8.6,11,6.2,13.8,15,14,12,16,15,17,18,17.2" />8: <Close DoubleValues="8.6,11,6.2,13.8,15,14,12,16,15,17,18,17.2,18.5,17.8,18.6,19.8,18,16.9,15.6,14.7, 14.2,9: 13,13.2, 12.8,11,11.2,10.5,9.4,8.9,8.4,8,8.6,11,6.2,13.8,15,14,12,16,15,17,18,17.2,18.5" />10: <X>11: <Values>12: <wijmo:ChartXData DateTimeValue="2011-12-01" />13: <wijmo:ChartXData DateTimeValue="2011-12-02" />14: <wijmo:ChartXData DateTimeValue="2011-12-05" />15: <wijmo:ChartXData DateTimeValue="2011-12-06" />16: <wijmo:ChartXData DateTimeValue="2011-12-07" />17: <wijmo:ChartXData DateTimeValue="2011-12-08" />18: <wijmo:ChartXData DateTimeValue="2011-12-09" />19: <wijmo:ChartXData DateTimeValue="2011-12-12" />20: <wijmo:ChartXData DateTimeValue="2011-12-13" />21: <wijmo:ChartXData DateTimeValue="2011-12-14" />22: <wijmo:ChartXData DateTimeValue="2011-12-15" />23: <wijmo:ChartXData DateTimeValue="2011-12-16" />24: <wijmo:ChartXData DateTimeValue="2011-12-19" />25: <wijmo:ChartXData DateTimeValue="2011-12-20" />26: <wijmo:ChartXData DateTimeValue="2011-12-21" />27: <wijmo:ChartXData DateTimeValue="2011-12-22" />28: <wijmo:ChartXData DateTimeValue="2011-12-23" />29: <wijmo:ChartXData DateTimeValue="2011-12-26" />30: <wijmo:ChartXData DateTimeValue="2011-12-27" />31: <wijmo:ChartXData DateTimeValue="2011-12-28" />32: <wijmo:ChartXData DateTimeValue="2011-12-29" />33: <wijmo:ChartXData DateTimeValue="2011-12-30" />34: <wijmo:ChartXData DateTimeValue="2012-01-02" />35: <wijmo:ChartXData DateTimeValue="2012-01-03" />36: <wijmo:ChartXData DateTimeValue="2012-01-04" />37: <wijmo:ChartXData DateTimeValue="2012-01-05" />38: <wijmo:ChartXData DateTimeValue="2012-01-06" />39: <wijmo:ChartXData DateTimeValue="2012-01-09" />40: <wijmo:ChartXData DateTimeValue="2012-01-10" />41: <wijmo:ChartXData DateTimeValue="2012-01-11" />42: <wijmo:ChartXData DateTimeValue="2012-01-12" />43: <wijmo:ChartXData DateTimeValue="2012-01-13" />44: <wijmo:ChartXData DateTimeValue="2012-01-16" />45: <wijmo:ChartXData DateTimeValue="2012-01-17" />46: <wijmo:ChartXData DateTimeValue="2012-01-18" />47: <wijmo:ChartXData DateTimeValue="2012-01-19" />48: <wijmo:ChartXData DateTimeValue="2012-01-20" />49: <wijmo:ChartXData DateTimeValue="2012-01-23" />50: <wijmo:ChartXData DateTimeValue="2012-01-24" />51: <wijmo:ChartXData DateTimeValue="2012-01-25" />52: <wijmo:ChartXData DateTimeValue="2012-01-26" />53: <wijmo:ChartXData DateTimeValue="2012-01-27" />54: <wijmo:ChartXData DateTimeValue="2012-01-30" />55: <wijmo:ChartXData DateTimeValue="2012-01-31" />56: </Values>57: </X>58: </Data>
Step3:
选择SreiesStyles,设置CandlestickCharts的外观。此示例中将Close-Fill-Color设置为Blue,Close-Width设置为5 。依次为FallingClose、HighLow、Open、RisingClose、UnchangeClose进行设置。
源视图下的代码如下:
1: <HighLow Width="2">2: <Fill Color="#8C8C8C"></Fill>3: </HighLow>4: <FallingClose Width="6">5: <Fill Color="#F07E6E"></Fill>6: </FallingClose>7: <RisingClose Width="6">8: <Fill Color="#90CD97"></Fill>9: </RisingClose>
Step4:
在源视图下可以更改图表坐标轴的外观,此示例做如下代码的的更改:
1: <Axis>2: <X>3: <GridMajor Visible="True"></GridMajor>4: <GridMinor Visible="True"></GridMinor>5: <TickMajor Position="Cross">6: </TickMajor>7: </X>8: <Y Visible="False" Compass="West">9: <Labels TextAlign="Center"></Labels>10: <GridMajor Visible="True"></GridMajor>11: <GridMinor Visible="False"></GridMinor>12: </Y>13: </Axis>
至此我们就完成了一个CandlestickChart的绘制,运行可以看到如下的效果:
