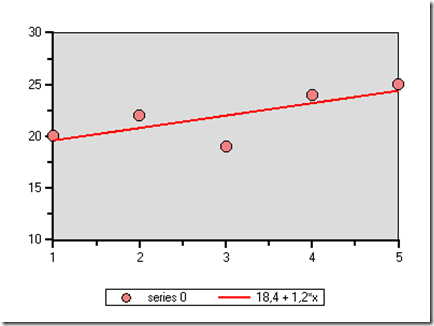
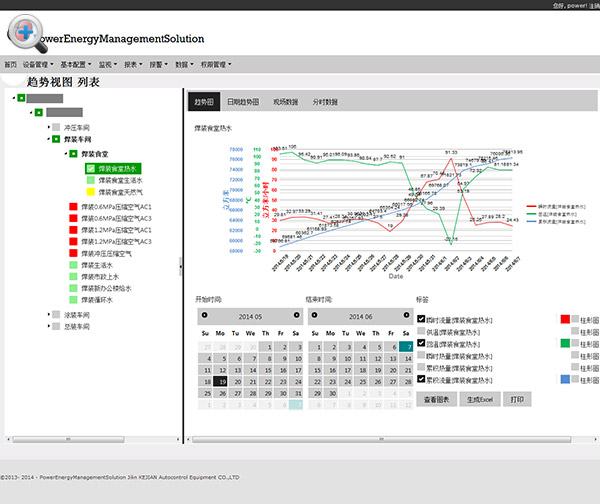
趋势线(Trendlines)用于结合Chart展示数据,分析趋势结果。
在ComponentOne Chart for Winform下,我们有2种途径创建趋势线:
1 Static (静态)
2 Dynamic (动态)
- 途径一:C1Chart如何创建Static Trendlines(静态趋势线)
C1Chart API提供了添加趋势线的接口,http://helpcentral.componentone.com/nethelp/c1chart2d/#creatingtrendlines.html">文档链接。
1: // create trend line
2: C1.Win.C1Chart.TrendLine tl = new C1.Win.C1Chart.TrendLine();
3: // first data series
4: tl.SeriesIndex = 0;
5: // set line color and thickness
6: tl.LineStyle.Color = Color.Red;
7: tl.LineStyle.Thickness = 2;
8: // show formula in legend
9: tl.Text = "{#FORMULA}";
10: // add trend to the chart
11: c1Chart1.ChartGroups[0].ChartData.TrendsList.Add( tl);
12:
13:
- 途径二:C1Chart如何创建(动态趋势线)
- 原理:通过自定义C1Chart趋势线对象。 首先创建一个继承自接口http://helpcentral.componentone.com/nethelp/c1chart2d/#C1.Win.C1Chart.4~C1.Win.C1Chart.ICustomTrendLine.htm的类,我们实例化它,并赋值给C1Chart的CustomTrendLine属性。
- 代码如下:
  1: public class CustomTrendLine : C1.Win.C1Chart.ICustomTrendLine
  2: {
  3:     private double[] _x;
  4:
  5:     private double[] _y;
  6:
  7:     public void Calculate(C1.Win.C1Chart.TrendLine tl, double[] x, double[] y)
  8:     {
  9:
 10:         if (x == null || x.Length == 0 || y == null || y.Length == 0)
 11:         {
 12:             _x = null; _y = null;
 13:             return;
 14:         }
 15:
 16:         // find min and max
 17:         double xmin = x[0], xmax = x[0];
 18:         double ymin1 = y[0], ymax1 = y[0];
 19:
 20:         ChartTrendline ff = new ChartTrendline();
 21:         xmin = ff.c1Chart1.ChartArea.AxisX.Min;
 22:         xmax = ff.c1Chart1.ChartArea.AxisX.Max;
 23:
 24:         ymin1 = ChartTrendline.y1();
 25:         ymax1 = ChartTrendline.y2();
 26:
 27:         _x = new double[2];
 28:         _y = new double[2];
 29:
 30:         _x[0] = xmin; _y[0] = ymin1;
 31:         _x[1] = xmax; _y[1] = ymax1;
 32:         }
 33:
 34:
 35:
 36:     public double[] GetXValues() { return _x; }
 37:
 38:     public double[] GetYValues() { return _y; }
 39:
 40:
 41:
 42:     // don't use it just return something
 43:
 44:     public double GetY(double x) { return 0; }
 45:
 46:     public string Text { get { return "Custom trend"; } }
 47:
 48: }
 49:
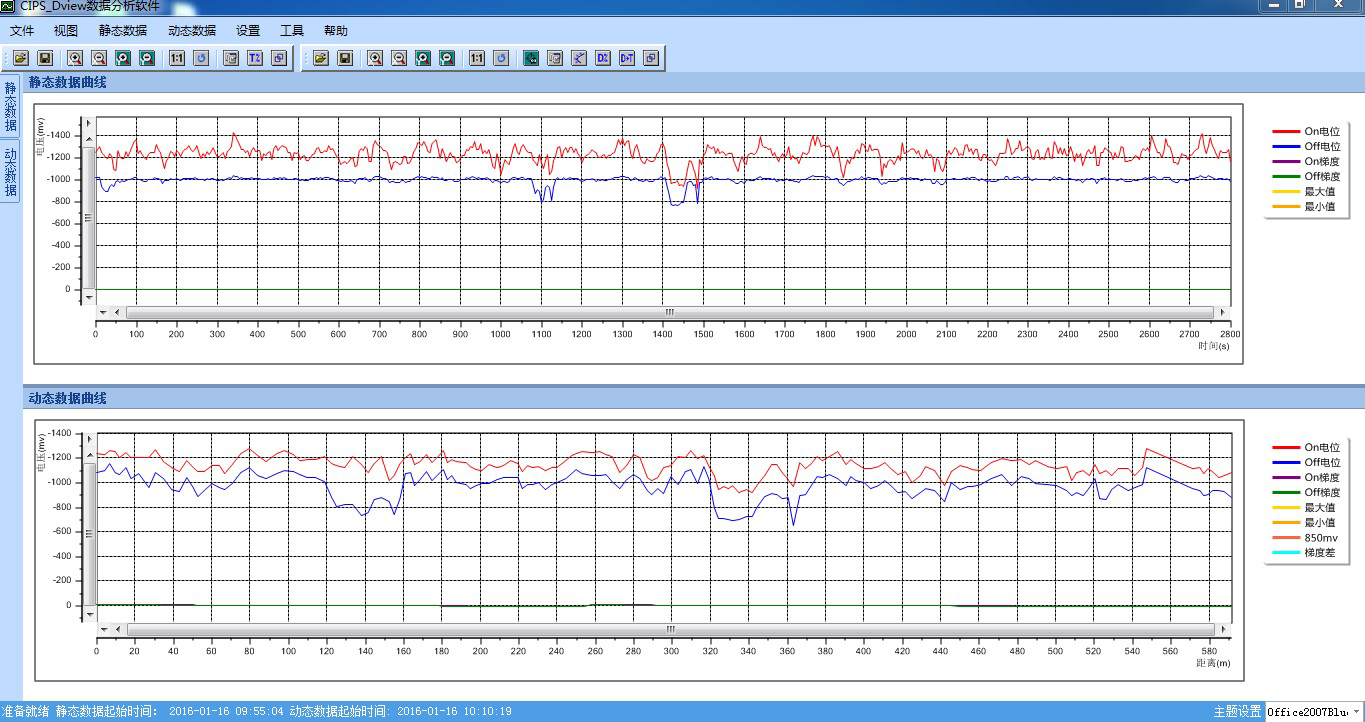
处理上面截图的TrackBars的ValueChanged、MouseUp时间,即动态绘制趋势线,代码如下:
  1: //Create static variables used to plot Custom
  2: //Trendlines to track the current on the TrackBars
  3: static bool bar1 = false;
  4: static int a = 0,b = 0;
  5: public static int y1()
  6: {
  7:     if (bar1 == true)
  8:         return b;
  9:     else
 10:     return a;
 11: }
 12:
 13: public static int y2()
 14: {
 15:     if (bar1 == true)
 16:         return a;
 17:     else
 18:     return b;
 19: }
 20: bool draw = false;
 21: //Capture the Trackbar Values
 22: private void trackBar1_ValueChanged(object sender, EventArgs e)
 23: {
 24:     bar1 = true;
 25:     draw = true;
 26:     a = trackBar1.Value;
 27:     b = trackBar2.Value;
 28: }
 29:
 30: private void trackBar1_MouseUp(object sender, MouseEventArgs e)
 31: {
 32:     if (draw)
 33:     {
 34:         DrawLevelLine();
 35:         draw = false;
 36:     }
 37: }
 38:
 39: private void trackBar2_ValueChanged(object sender, EventArgs e)
 40: {
 41:     bar1 = false;
 42:     draw = true;
 43:     a = trackBar1.Value;
 44:     b = trackBar2.Value;
 45: }
 46:
 47: private void trackBar2_MouseUp(object sender, MouseEventArgs e)
 48: {
 49:     if (draw)
 50:     {
 51:         DrawLevelLine();
 52:         draw = false;
 53:     }
 54: }
 55: private void DrawLevelLine()
 56: {
 57:     c1Chart1.ChartGroups[0].ChartData.TrendsList.Clear();
 58:     // create trend line
 59:     C1.Win.C1Chart.TrendLine tl = c1Chart1.ChartGroups[0].ChartData.TrendsList.AddNewTrendLine();
 60:     // setup line properties
 61:     tl.LineStyle.Color = Color.DarkRed;
 62:     tl.LineStyle.Thickness = 3;
 63:     tl.LineStyle.Pattern = C1.Win.C1Chart.LinePatternEnum.Dash;
 64:     // set custom trend line
 65:     tl.CustomTrendLine = new CustomTrendLine();
 66:     if(bar1 == true)
 67:     bar1 = false;
 68: }
 69:
完整源码如下:
