<script type="text/javascript">
$(document).ready(function () {
    $("#wijbubblechart").wijbubblechart({
        axis: {
            //sets the title text for the Y axis
            y: {text: "Number of Products"},
            //sets  the title text for the X axis and formats
            //the X axis labels as currency with no decimal spaces
            x: {text: "Sales", annoFormatString: "C0"}
        },
        header: {
            //sets the background color of the header to pale grey
            style: {fill: "gainsboro"},
            //sets the text to display in the header
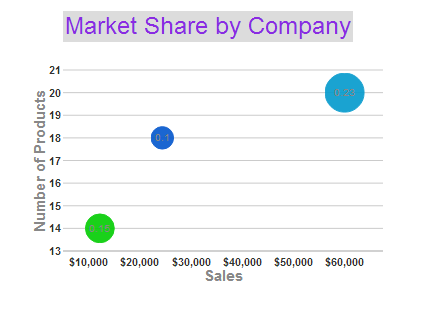
            text: "Market Share by Company",
            //sets the header text style
            textStyle: {"font-size": 24, fill: "blueviolet"}
        },
        //hides the legend
        legend: {visible: false},
        //adds three data series to the chart
        seriesList: [
        {
            //sets the text to use in the tooltip for the bubble
            label: "Company A Market Share",
            //sets the Y value (number of products),
            //the X value (sales), and the Y1 (market share)
            data: { y: [14], x: [12200], y1: [.15] }
        }, {
            label: "Company B Market Share",
            data: { y: [20], x: [60000], y1: [.23] }
        }, {
            label: "Company C Market Share",
            data: { y: [18], x: [24400], y1: [.1] }
        }]
    });
});
</script>
|

