Wijmo UI for the Web
Quick Start
| Wijmo User Guide > Widgets > BubbleChart > Quick Start |
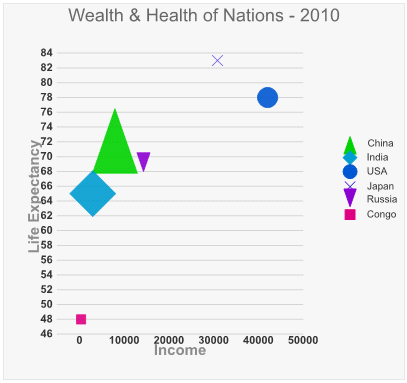
In this quick start, you will learn how to add the BubbleChart widget to an HTML project and how to customize the BubbleChart.
Drop down and copy markup to paste in Notepad
Drop down and copy references to paste inside the head tags
Drop down and copy markup to paste inside the body tags
Drop down and copy markup to paste inside the head tags
