| Wijmo User Guide > Concepts > Knockout > Knockout Pie Chart |

1. Add Library References
The first step is to create an .html page and add links to the dependencies to your project within the <head> tags. To do this, link to the content delivery network (CDN) files:
 |
Note: Please reference the latest dependencies from the CDN at http://www.wijmo.com/downloads/cdn. |
| References |
Copy Code
|
|---|---|
<!--jQuery References--> <script src="http://code.jquery.com/jquery-1.9.1.min.js" type="text/javascript"></script> <script src="http://code.jquery.com/ui/1.10.1/jquery-ui.min.js" type="text/javascript"></script> <!--Theme--> <link href="http://cdn.wijmo.com/themes/aristo/jquery-wijmo.css" rel="stylesheet" type="text/css" /> <!--Wijmo Widgets CSS--> <link href="http://cdn.wijmo.com/jquery.wijmo-pro.all.3.20132.15.min.css" rel="stylesheet" type="text/css" /> <!--Wijmo Widgets JavaScript--> <script src="http://cdn.wijmo.com/jquery.wijmo-open.all.3.20132.15.min.js" type="text/javascript"></script> <script src="http://cdn.wijmo.com/jquery.wijmo-pro.all.3.20132.15.min.js" type="text/javascript"></script> |
|
Then add a reference to Knockout 2.0 and the Knockout extension library for Wijmo within the <head> tags:
<!--Knockout JS library-->
<script src="http://cdn.wijmo.com/external/knockout-2.0.0.js" type="text/javascript"></script>

<!--Wijmo Knockout Integration Library-->
<script src="http://cdn.wijmo.com/external/knockout.wijmo.js" type="text/javascript"></script>
2. Create the ViewModel and View
Now create a view model to define the data and behavior of the UI. Enter the following <script> within the <head> tags:
| Create ViewModel Script |
Copy Code
|
|---|---|
<script type="text/javascript"> //Create ViewModel--> var viewModel = function () { var self = this; self.males = ko.numericObservable(10); self.females = ko.numericObservable(90); }; </script> |
|
To create the wijpiechart HTML element, place the following markup within the body of the .html document. This serves as the View in the MVVM pattern.
| View Markup |
Copy Code
|
|---|---|
<!--Create View--> <div> males: <input type="text" data-bind="value: males" /> females: <input type="text" data-bind="value: females" /> </div> <div class="piechart" data-bind="wijpiechart: { width: 600, height: 400, seriesList: [ {label: 'Male', data: males}, {label: 'Female', data: females} ]}"> </div> |
|
3. Bind Wijmo Widgets to the ViewModel and Activate KO
Now bind to the ViewModel and activate knockout.js by adding the following JavaScript within the <script> tags after the ViewModel script:
| Bind ViewModel |
Copy Code
|
|---|---|
<!--Bind ViewModel-->
         $(document).ready(function () {
             var vm = new viewModel();
             ko.applyBindings(vm);
}); |
|
Here is the full wijpiechart sample markup.
| Full Markup |
Copy Code
|
|---|---|
<!DOCTYPE html PUBLIC "-//W3C//DTD XHTML 1.0 Transitional//EN" "http://www.w3.org/TR/xhtml1/DTD/xhtml1-transitional.dtd"> <html xmlns="http://www.w3.org/1999/xhtml"> <head> <title></title> <script src="../../external/jquery-1.7.1.min.js" type="text/javascript"></script> <script src="../../external/jquery-ui-1.8.18.custom.min.js" type="text/javascript"></script> <script src="../../external/globalize.min.js" type="text/javascript"></script> <script src="../../external/raphael-min.js" type="text/javascript"></script> <script src="../../wijmo/jquery.wijmo.raphael.js" type="text/javascript"></script> <script src="../../wijmo/jquery.wijmo.wijchartcore.js" type="text/javascript"></script> <script src="../../wijmo/jquery.wijmo.wijpiechart.js" type="text/javascript"></script> <script src="../../wijmo/jquery.wijmo.wijutil.js" type="text/javascript"></script> <script src="../../wijmo/jquery.wijmo.wijslider.js" type="text/javascript"></script> <script src="../../external/knockout-2.0.0.js" type="text/javascript"></script> <script src="../../../../Wijmo-Open/development-bundle/wijmo/knockout.wijmo.js" type="text/javascript"></script> <script type="text/javascript"> <!--Create ViewModel--> var viewModel = function () { var self = this; self.males = ko.numericObservable(10); self.females = ko.numericObservable(90); }; <!--Bind ViewModel--> $(document).ready(function () { var vm = new viewModel(); ko.applyBindings(vm); }); </script> </head> <body> <!--Create View--> <div> males: <input type="text" data-bind="value: males" /> females: <input type="text" data-bind="value: females" /> </div> <div class="piechart" data-bind="wijpiechart: { width: 600, height: 400, seriesList: [ {label: 'Male', data: males}, {label: 'Female', data: females} ]}"> </div> </body> </html> |
|
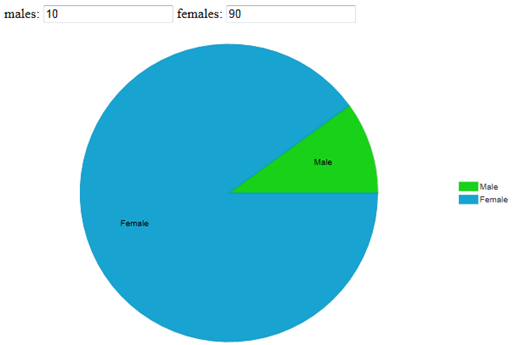
When you open the page, the wijpiechart looks similar to the image above. Enter new values for the males and females, and the pie updates accordingly.
 Show All
 Hide All